The first Address Quality benchmark result was 49.1%, as documented in How I Benchmark Address Quality.
Lower than the odds of a coin toss. LOL.
But the benchmark does more than give me a number. It keeps the result for every address: the expected location, API response, generated candidates, and their confidence.
That report gives me something to inspect when the number looks bad.
I went through the report expecting to find problems in the engine, but the first mistake I found was in the test data.
What if the expected result is wrong?
The benchmark currently uses 106 addresses. For each address, I have an expected province, city, district, and subdistrict.
The benchmark sends the address to the API and compares the result with those expected values. If all four levels match, I count it as correct.
This works only if the expected values are correct.
One failed case looked like this:
JL. CIPANAS BARU, PANJALING, KEC. TAROGONG KALER,
KAB. GARUT, JAWA BARAT 44151
At first, the address looks reasonable. It contains a road, location names, an administrative hierarchy, and a postal code.
The API result did not match my expected value, so the benchmark marked it as incorrect. When I checked the address again, however, the expected value was the problem.
Panjalin is a real location, but it belongs to Kecamatan Sumberjaya, Kabupaten Majalengka. The road location in this address points to Pananjung, Tarogong Kaler. The individual names looked valid, but their relationship was not.
This is difficult to catch by reading the address alone. I had created the expected values from address data that looked reasonable, but I had not properly reviewed whether every administrative relationship was correct.
If I trusted the failed test immediately, I could change the engine to match a wrong expectation.
So I stopped changing the engine and reviewed the dataset instead. Rather than correcting only this address, I went through all 106 records again and checked their expected administrative hierarchy.
After correcting the test data, I ran the benchmark again.
Before review: 49.1%
After review:  52.8%
The score increased by 3.7 percentage points without changing the engine. The API did not improve in this step; the benchmark became more reliable because I corrected the data used to measure it.
The benchmark v0.1.0-alpha-revision-106-1 document shows this improvement.
Then confidence 1.0 started looking suspicious
With the expected values reviewed, I went back to the benchmark report.
Another pattern started to appear. Several addresses had two or more candidates with confidence 1.0.
One example was:
JL. Raya Cimareme No.296, Cimareme, Kec. Ngamprah,
Kabupaten Bandung Barat, Jawa Barat 40553
The engine found evidence for Cimareme, Ngamprah, Kabupaten Bandung Barat, and Jawa Barat.
There is something interesting about this address.
Ngamprah is both a district and a subdistrict inside that district.
So these are both valid administrative hierarchies:
Candidate A

Subdistrict: Ngamprah
District:    Ngamprah
City:        Kabupaten Bandung Barat
Province:    Jawa Barat
Confidence:  1.0
Candidate B

Subdistrict: Cimareme
District:    Ngamprah
City:        Kabupaten Bandung Barat
Province:    Jawa Barat
Confidence:  1.0
The engine was not generating a random invalid candidate. Candidate A exists in the location data, and Candidate B exists too.
Both also have evidence from the address supporting their hierarchy, which explains why both could reach confidence 1.0. But the address contains another piece of evidence that separates them: Cimareme.
Candidate B can explain all four pieces of location evidence:
Cimareme      → Subdistrict
Ngamprah      → District
Bandung Barat → City
Jawa Barat    → Province
Candidate A can build a valid hierarchy using Ngamprah, but Cimareme is left unused:
Ngamprah      → Subdistrict + District
Bandung Barat → City
Jawa Barat    → Province

Cimareme      → ?
That changed how I looked at the problem. Candidate A was not invalid; it was a valid location hierarchy that explained less of the address.
My ranking logic rewarded evidence that supported a candidate, but it did not sufficiently consider relevant evidence that the candidate left unexplained.
That was how two valid candidates could both reach confidence 1.0, even when one fit the complete address better.
Changing the weights would hide the problem
I could increase the weight of Cimareme until Candidate B wins, but there is no reason to make Cimareme inherently more important.
In another address, Ngamprah might genuinely be the intended subdistrict. Both hierarchies are valid.
The useful signal is not which location name I prefer, but how much of the input each candidate can explain.
I also considered allowing confidence to go above 1.0. That would give Candidate B more room to accumulate a higher score, but it still would not explain why Candidate A could reach maximum confidence while leaving part of the address unexplained.
The information I needed was already available in the unused evidence.
Penalizing evidence that a candidate ignores
The engine already tracks which evidence contributes to each candidate.
I used that information after calculating the normal confidence score. If relevant location evidence remains unused, the candidate receives a small penalty.
In simplified form: confidence = existing confidence - unused evidence penalty.
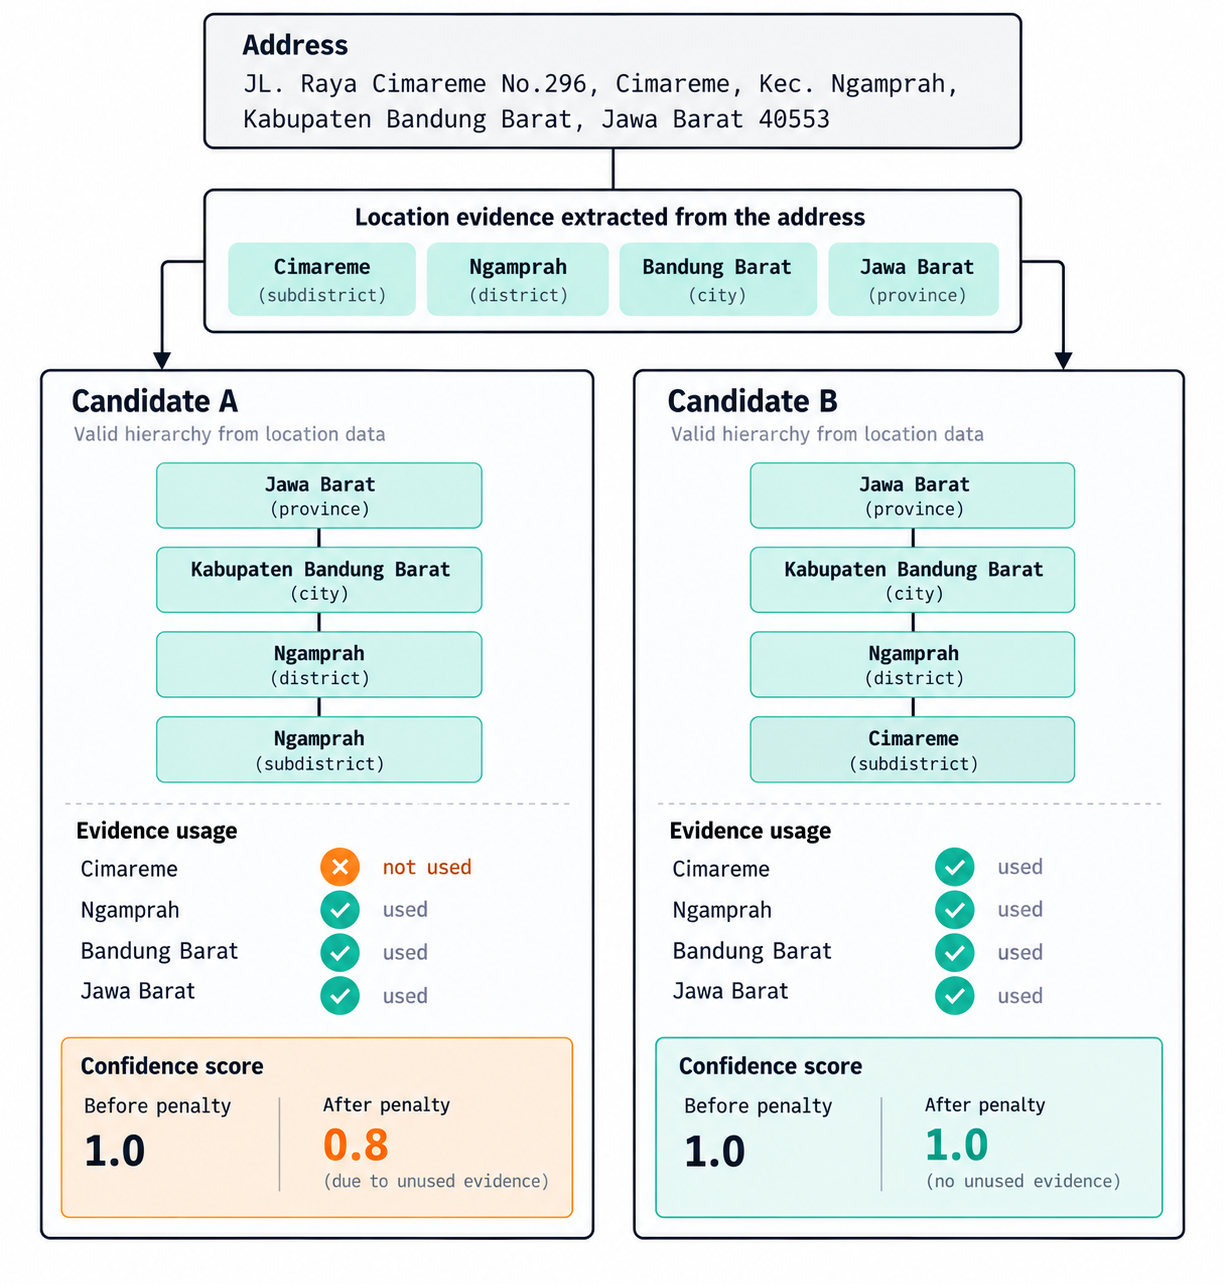
The diagram shows the difference. Candidate A is a valid hierarchy, but it leaves Cimareme unused, so its confidence drops from 1.0 to 0.8. Candidate B uses all the extracted location evidence and keeps its confidence at 1.0.
For Candidate B, all four location values contribute to the hierarchy, while Candidate A leaves Cimareme unused.
The penalty does not say that Candidate A is invalid. For this particular input, it says there is more evidence supporting Candidate B.
I ran the same benchmark again.
After dataset review:          52.8%
After unused-evidence penalty: 57.5%
The benchmark improved by another 4.7 percentage points. Unlike the first improvement, this one came from changing the engine.
The benchmark v0.1.1-alpha document shows this result.
The same report found two different problems
I started with a benchmark result of 49.1%.
Reviewing the failures showed that some expected values were unreliable. I reviewed all 106 records, corrected the test data, and the result moved to 52.8%.
Then the same report showed several cases where different candidates could reach confidence 1.0. Looking at the evidence they used showed that some candidates could ignore part of the address without paying any cost.
Adding the unused-evidence penalty moved the benchmark again to 57.5%.
So the two improvements came from different places:
49.1% → 52.8%
Reviewed and corrected the test data
+3.7 percentage points

52.8% → 57.5%
Penalized candidates that ignore evidence
+4.7 percentage points
The final number is still not particularly high. The dataset contains only 106 addresses, so this does not mean Address Quality is 57.5% accurate for Indonesian addresses in general.
But I trust this benchmark more than the one I started with. I have now reviewed the expected result for every record instead of assuming the labels are correct.
Running the test is also cheap:
make benchmark
It takes less than ten seconds to run all 106 addresses again. I can make a small change, run the same dataset, and check both what improved and what became worse.
Series: Address Quality